Raster file scaling – you can always zoom in the map a little because its high resolution allows for it. However, remember to change its sides proportionally.
Vector file scaling – vector pdf files are scalable without losing technical quality but at a high loss of substantive quality. A zoomed-out map becomes too detailed, i.e. it becomes illegible, while a zoomed-in map becomes too thickened, which simply looks bad. Therefore, we don’t recommend scaling; it is worth adopting the target size during personalisation.
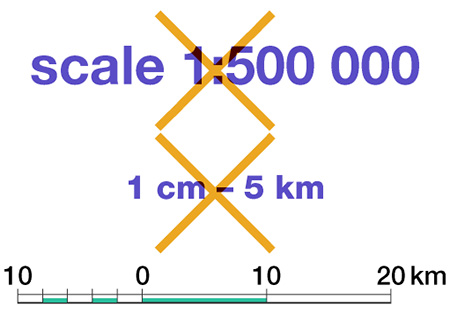
Scale – after zooming in or out the map, remember to cover the principal scale and the nominal scale with a white rectangle. However, you can leave the scale bar as it is always correct.
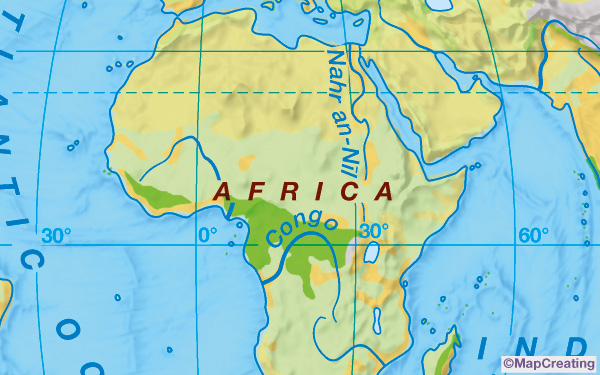
Scale distortions – the scale of each map is accurately preserved only in selected places, and therefore it should be treated with some approximation. This is due to distortions or differences between distances, angles, and surfaces measured on the Earth model (reference surface) and the plane after mapping. In the case of small areas, the distortions are usually minor, but for maps of the world and continents, in some places, they can reach significant values.
Cartographic projections – maps have different projections, depending on the scale. For large scales of up to 1:250,000, this is a Mercator transverse cylindrical projection, and the system is compatible with UTM zones, except for polar areas. Medium-scale maps, i.e. in the range of 1:270,000 – 1:4 500,000, are in a Lambert true-angle projection with the north direction adjusted to the nearest meridian at an interval of 1°. Maps of continents at small scales, i.e. in the range of 1:5,000,000 – 1:120,000,000, are in the Lambert equal-area projection or Times projection. Large maps of the world are in the Times projection, and small maps, from a scale of 1:65,000,000 – in the Mollweide equal-area projection.
Size – the large size of maps in pixels, centimetres/ inches, or gigabytes, as well as the saving format, all have an impact on handling the maps by different software. If a given map is over 1m/ 40” in size, or has a resolution of 600 dpi, or contains a lot of content elements or it is in vector format, you should carefully read the guidelines below to avoid potential problems in the future work.
Resolution – it is worth adjusting the resolution of the generated map to specific needs so that, on the one hand, the map has a high technical quality, and on the other– it does not overload the system. 300 dpi is suitable for photography, but for offset map printing it is not enough; keylines and small names will not be sharp. 600 dpi should be enough. In the case of plotter printing, it all depends on the distance from which the map will be read; if it is a handheld map, then 600 dpi is also the best, as long as the plotter can use it.
Saving formats – the map’s draft image is exported in jpg, RGB, 120 dpi format, with a watermark. You can export the final map in jpg format, tiff format or pdf raster format; for last both, you can select the special quality mode – this applies to all licences except the Basic Licence – Umowa Licencyjna Podstawowa. You can also export the map in an encapsulated vector pdf format, with or without layers supported by Adobe AcrobatReader®. CMYK or RGB colour model, resolution up to 600 dpi.
Pdf – you can open a pdf map using Adobe AcrobatReader®. For large maps, please wait until the second refresh of the image to easily move it and zoom.
Map comments – map files in Adobe AcrobatReader® can be tagged with comments having significantly different graphics and saved for future reference. That way, you can create a personal layer of information. You can find the tool for displaying them in Adobe AcrobatReader® here.
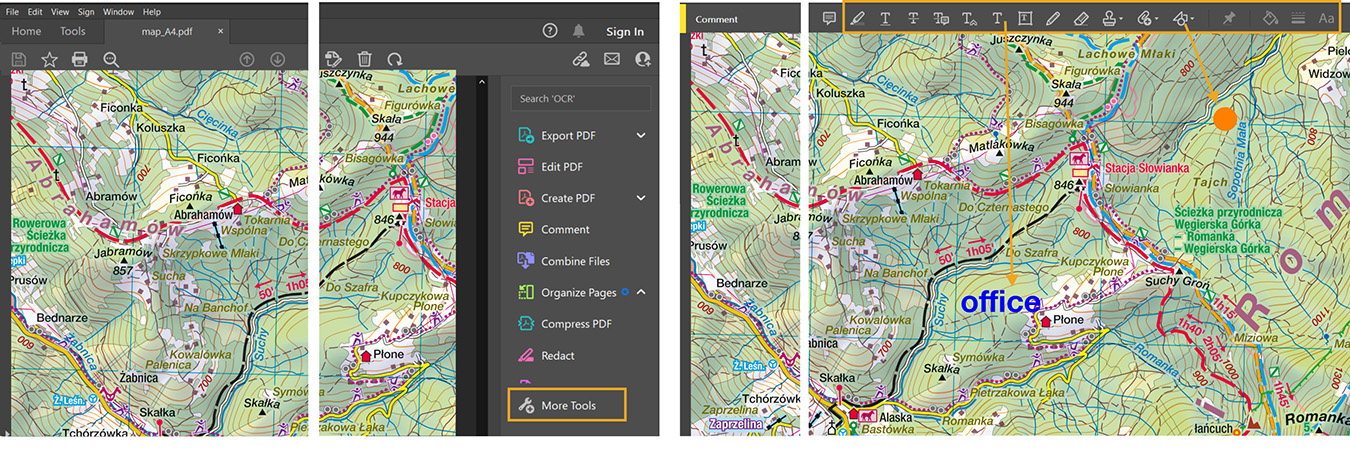
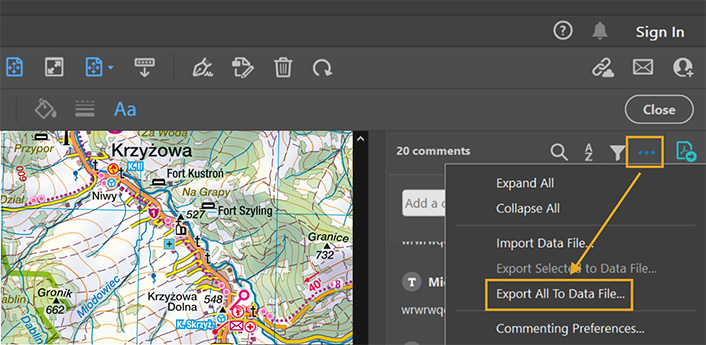
You can export your comments to give them to someone else or change them, for example, in a year when you decide to generate a new, up-to-date map with MapCreating.
Raster pdf – you can open raster pdf files using, for example, Adobe Illustrator®, CorelDraw®, Adobe Photoshop®, or Adobe InDesign® and add your own content on top. In the case of maps with very large sizes – of more than 30.000 pixels for one size – the file may not open.
Tiff – tiff files are best for maps in large formats. You can open them using any graphic software. Your printing house will not have any problems with them, although it may prefer pdf files, it is better to consult it beforehand.
Jpg – files in jpg format are in the RGB color model. They are readable by all programs. Remember please, that the map size is flexibly adjusted to the screen size, according to the pixel dimensions of the image – not according to the map scale.
Georeference in tiff (in a future) – tiff files contain georeference in the header and include accompanying files in the tfw format, and therefore, can be opened using a GIS software. Re-saving files with Adobe Illustrator®, CorelDraw®, Adobe Photoshop® or Adobe InDesign® will result in losing the georeference from the header, but if you keep the file name and size in pixels unchanged, the tfw file will still be able to properly embed the map in GIS software.
Georeference in pdf – pdf files contain the georeference in the header. After opening maps with Adobe AcrobatReader ®, it is possible to view this georeference using the Dimensions/ Location Search tool.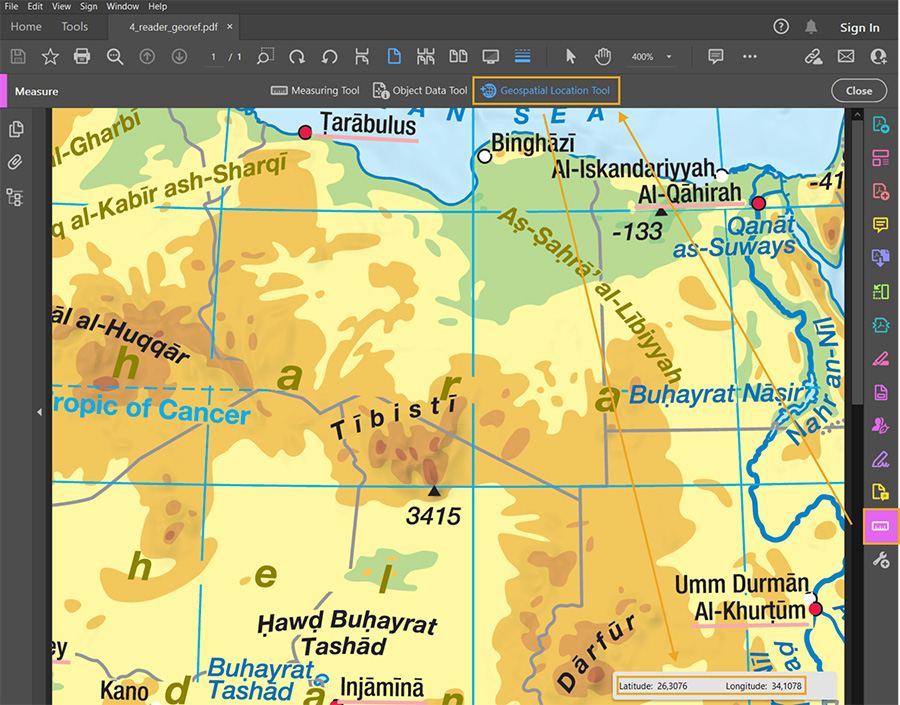 Re-saving files with Adobe Illustrator®, CorelDraw®, Adobe Photoshop®, or Adobe InDesign® will result in losing the georeference.
Vector pdf – vector pdf files are encapsulated, which means they cannot be edited. However, you can open such files using Adobe Illustrator® or Adobe InDesign® and add your data on top.
Vector pdf – vector pdf files generate quickly, but because they contain a lot of data, they are difficult to read for graphics programs and browsers. We suggest using this format for simple files containing relatively little information, but they can be large in cm/ inches. The best solution is the raster format.
Layers – vector pdf files can contain thematic layers. You can find the tool for displaying them in Adobe AcrobatReader® here.
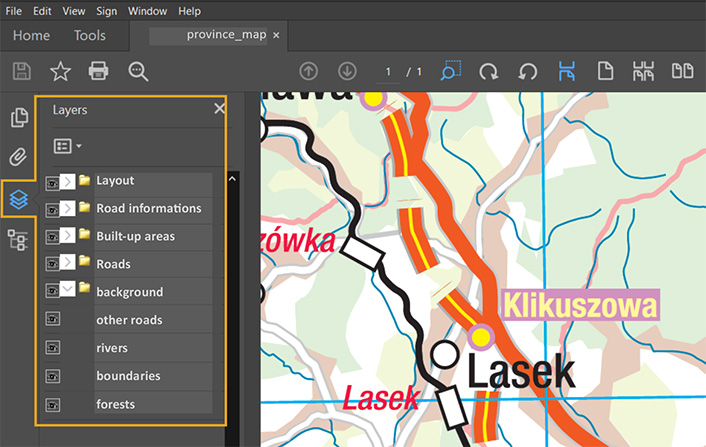
You can enable or disable any of them, adapting the content to your current needs, such as a presentation during a meeting or data analysis. Each map layer includes one group of elements corresponding to the list of categories in tab 2 Content/ Base content elements; their names are abbreviated but distinguishable in English. Layers are not visible in a browser’s pdf plug-in. Do not re-save the file with Adobe Illustrator®, or you will lose the layers.
Pdf saved with Adobe Illustrator® – you can open vector pdf files saved with Adobe Illustrator® in Adobe Photoshop® by rasterising them. If they do not contain asymmetrical lines, you can also open them in CorelDraw® – then check the map carefully.
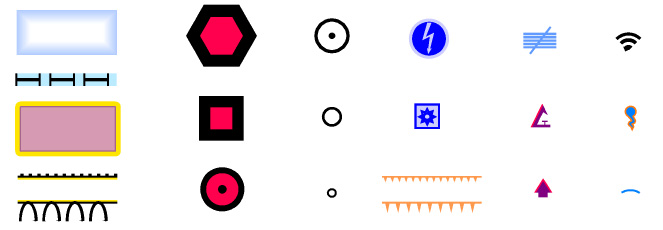
Asymmetrical lines – these are glaciers, sea boundaries, monumental buildings, walls and fences, aqueducts, and city walls. Also, a number of point symbols are constructed with the use of asymmetrical lines, e.g. localities, power plants, solar farms, gradients, raft piers, shelters, sheds, amphitheatres, hot springs, and rapids.
RGB colour model – GIS software and web browsers prefer the RGB model. The maps displayed there, created in the CMYK model, may include distorted colours or not display at all.
Overprints – in offset printing of large volumes, black and some other colour elements overprints are needed. They are included in vector files and raster files exported in special quality mode, providing great technical results but causing the final generation stage to take 10 times longer.
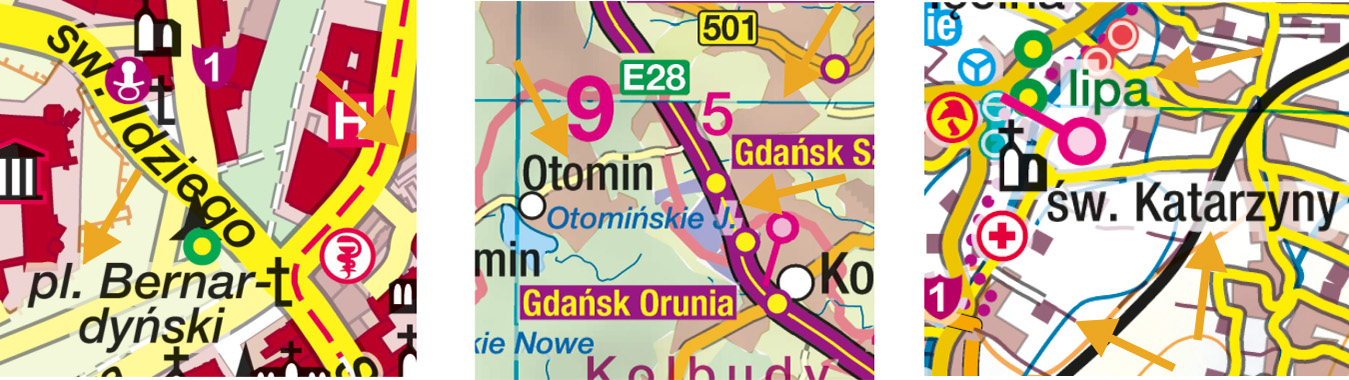
Special quality mode – in the special quality mode, the lines and surfaces are much more legible under overlapping names and symbols. The background under names and symbols is hold-out selectively and in 75% only, so it is possible to see the streets, roads, or railways even in locations with a high density of names and symbols. Our solution is unique on a global scale. In this mode, all overprints are preserved, not only in black, but also in other colours, necessary to make the other elements of the map easier to read. This applies to graticule, names of some large regions and administrative units, keylines of landcover forms, building keylines, contour lines, road keylines, pipelines and power lines, as well as other minor ones.
Registration marks – maps do not contain registration marks and bleeds, as in most cases, they would interfere with the further use of the maps. In the case of a need to perform offset printout, we suggest adding registration marks and white bleeds in a graphic software. The map is always net size.
The border around the map – maps are generated with a white border around a gray frame. We strongly advise against changing the background inside the content, but it is acceptable outside the frame and can be done, for example, with Adobe Photoshop® or a similar software.
Retouch – if an object/ information is a problem for you, you can try to remove it in a raster software, although it is not easy. You just cannot delete/ obscure the MapCreating publishing imprint and licence number.
Watermark – draft images and maps for humanitarian purposes are watermarked.