We have been private map publishers for several decades. Around 2010, we determined that the problem with the availability of sources concerning updating maps was finally over, with websites providing comprehensive and up-to-date information on any subject, and spatial databases widely available. Since then, a map maker could obtain any information, bring a new one to the map, or update an existing one. Mapping became a pure pleasure.
The euphoria passed after a few years when our industry was affected by the issue of Big Data like a few others. The cost of using a significant amount of information, husking out what was important, turned out to be too high. On the other hand, the quality of free maps, scalable geoportals, and navigation, improved so much that the commercial offer became unattractive and map creation began to cost too much. The consequence was a decrease in printed maps, the disappearance of several titles, and even map categories and the liquidation of many respected cartographic publishing houses around the world. The online map maker replaced the paper map editor.
Maps are used by everyone every day, and there are ubiquitous, scalable maps on the web based on OSM, GoogleMaps®, and others. We use them, in a way, automatically, most often for a few seconds needed to determine our location or the location of what we are interested in. That’s why we got used to these maps, their specific content and graphics.
However, this does not mean that the need to use maps to a greater extent has disappeared. Although, a requirement appeared for a specific map to be illustrative. Up to that point, maps were created exclusively for the mass audience and were therefore overflowing with content potentially needed by thousands of users. Such a map was not illustrative; it was illegible and sometimes difficult to use. Therefore, the illustrative character means that the map includes what we need and only this, nothing more. It is possible to meet this condition by means of personalisation.
With our many years of experience in adjusting maps to the needs of users, we were able to define what questions customers ask and what needs to be adjusted to make a map custom. The following steps in the process, through which the customer goes, exactly coincide with these questions and provide the opportunity to give precise answers. Thanks to this, the user can then say, “these are My Maps”.
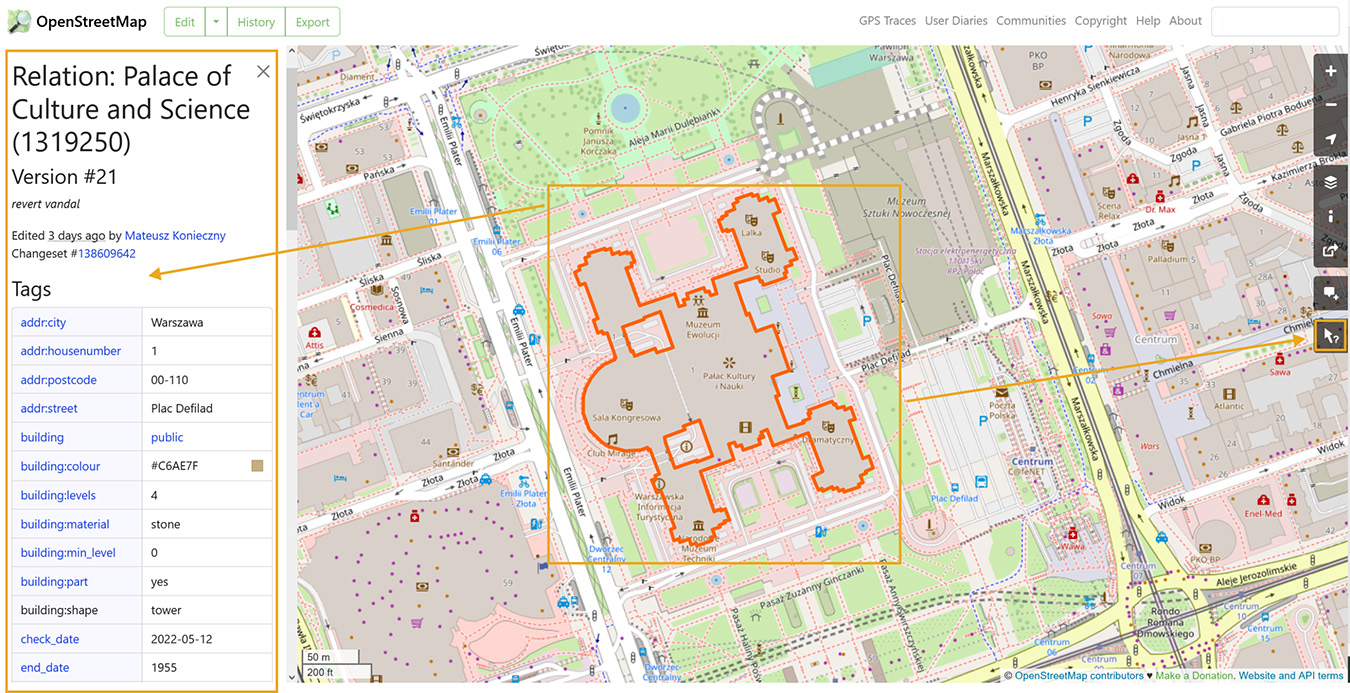
For geographic data to be useful, it must be reliable, up-to-date, and cartometric. Its structure should be suitable for further automatic use. Preferably, they should cover the entire world in a uniform manner. If maps are to be cheap, then access to the data must be free. When we talk about topographic base map data, there is one such database only – OSM. Even though we see a map in browsers, it is primarily a database; it used to show only streets; now it includes almost everything. It’s free, but that doesn’t mean that using it does not require financial expenditure. In 2023, the OSM database contained more than 9.5 billion objects; it was permanently edited by approx. 70,000 people, and incidentally – by over 8 million. Such a large number of editors allow us to cover the entire world in detail with data and update it. The downside of this solution is the lack of uniformity of information content.
OSM has an unusual structure for a spatial database; this is due to the fact that the content must be editable for enthusiasts. Undoubtedly, objects contain an insufficient amount of attributes to be able to apply the correct automatic generalisation, but it is difficult to require editors to fill in value columns for each object. Many attributes cross, overlap, and duplicate, making the task more difficult.
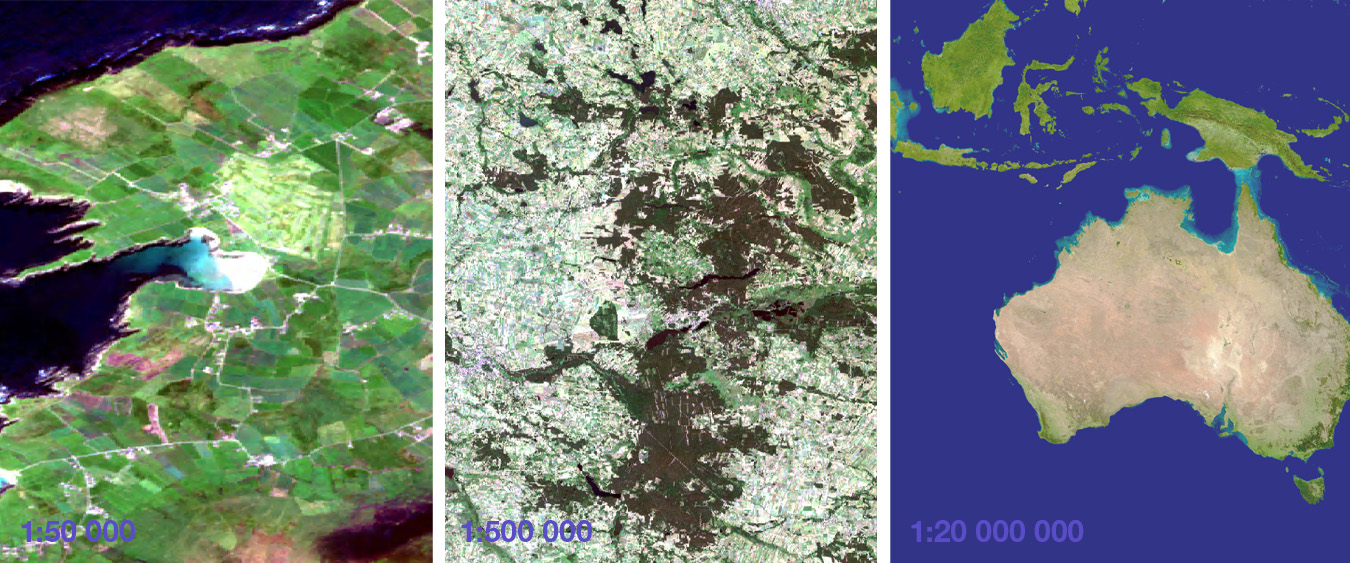
The database is perfect for making maps at the largest scales, such as 1:10,000. However, at smaller scales, problems appear, which can be easily seen at the OSM website: dual carriageway roads merge into lines of irregular width, spots of the forest become microscopically small, railway lines overlap, the number of displayed names drops drastically, and their selection becomes random, etc.
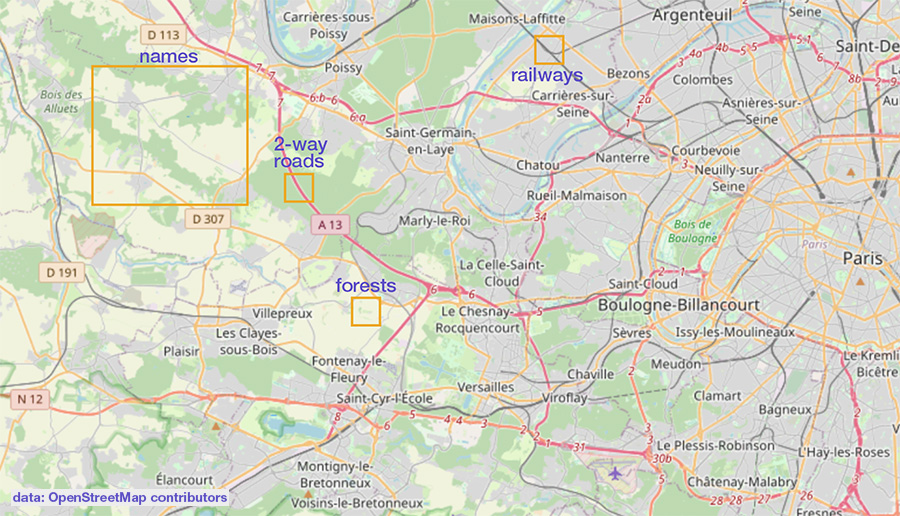
To organise this resource for the purposes of a map presentation on the scale of 1:50,000 or 1:200,000, it is necessary to perform a significant amount of generalisation work, which will be discussed next.
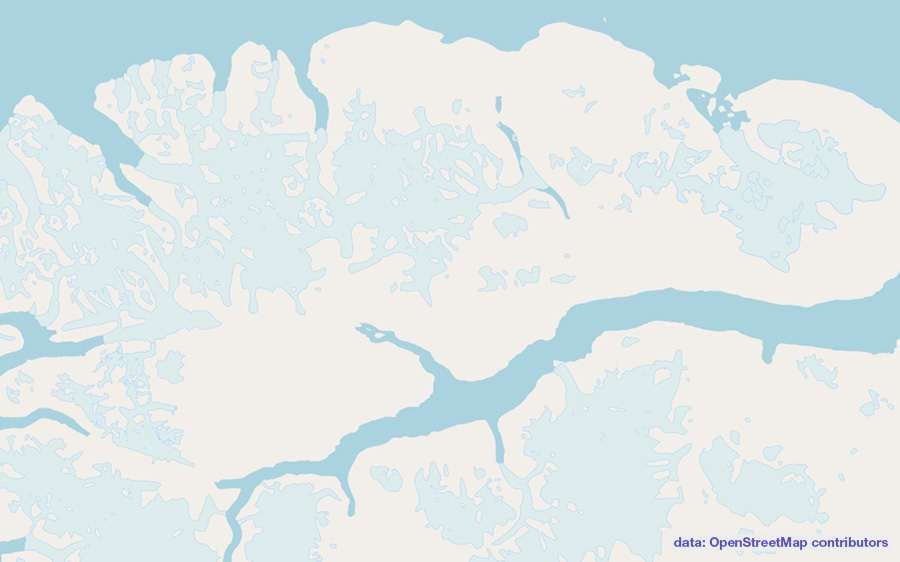
Polar areas have been mapped poorly in OSM, which is not surprising, seeing how there is not much going on there. Climate change is taking place so fast that we cannot offer reliable data concerning, for example, ice sheets or the coastline course in these areas.
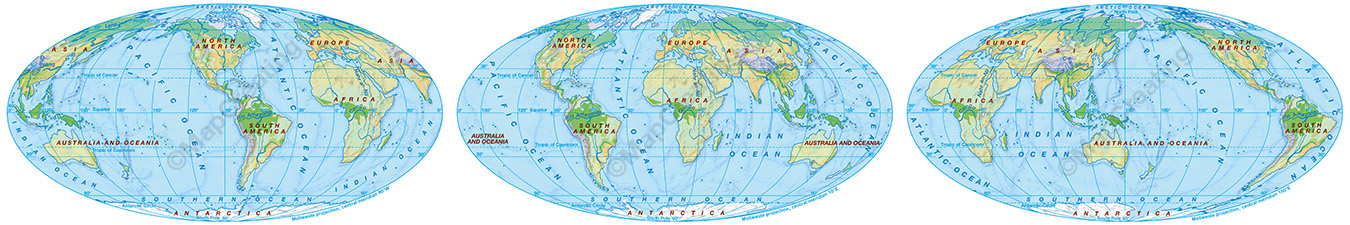
In the case of small scales, maps were created manually in LorikSoftware, on the base of data transferred from Natural Earth®. This database is good but requires extensive editing and updating. The world map editor completely rebuilt localities using the latest statistical data, including the number of inhabitants. Nomenclature on maps can be selected from 3 versions: English, Polish, and endonyms. We particularly recommend the latter, containing the original names of countries, localities, rivers, and parts of regions, written with the Latin alphabet.

Regardless of which region of the world you come from, you will find a detailed small-scale map for your area. So these are maps of continents and oceans in different scales/ sizes, while the world map can be chosen with a central meridian set for both Americas, for Europe with Africa, or for Asia with Australia and Oceania.
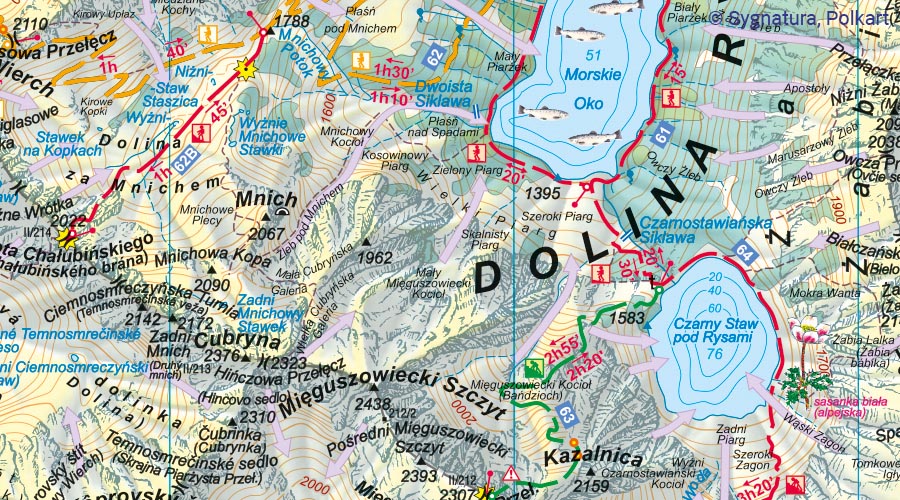
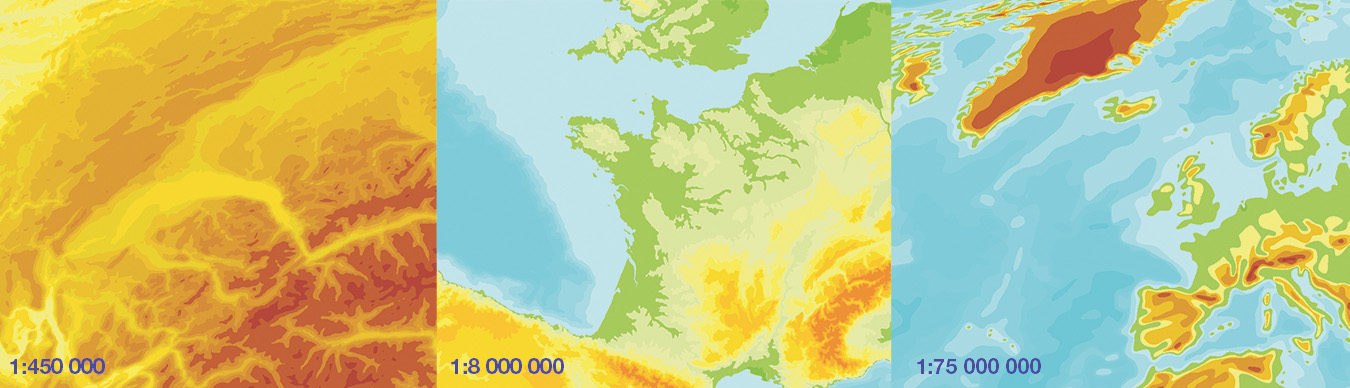
We had to take advantage of other sources to acquire that what was missing in OSM. For example, we believe that a good map should include hill shading, which significantly enriches every map, provided it is well done and does not burden it in visually. To generate it, we used the DEM NASA and Copernicus 30/ 90 m model. Taking advantage of complex methods, we used the five different hill shading versions to create colour one, corresponding to a scale of 1:44,000, composed of almost 50,000 tiles.
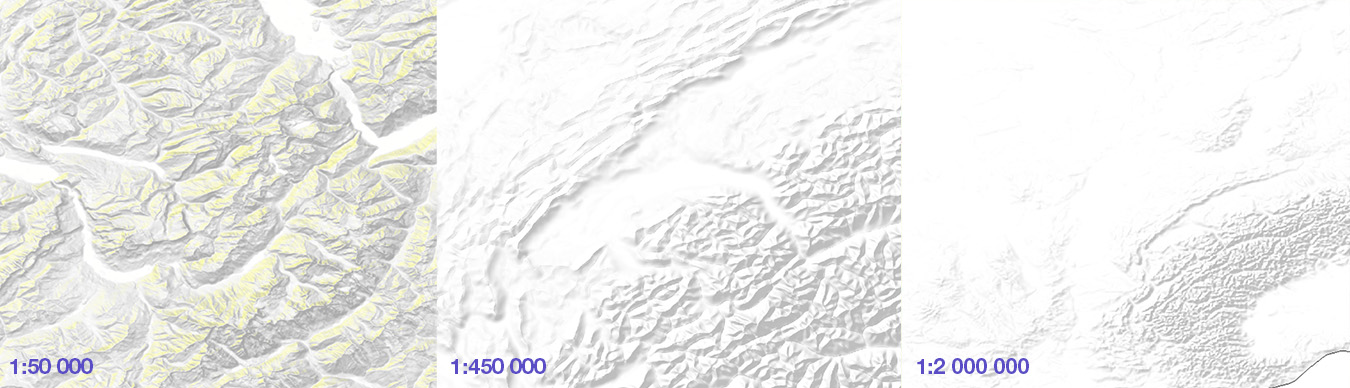
Naturally, for smaller scales, we have prepared separate hill shading with details that fit a specific scale. In terms of generalisation, the free TerrainSculptor software turned out to be very useful, which we warmly recommend. For small scales, we used DTM GTOPO30 USGS with a resolution of 1 km. Our hill shading is properly generalised, and the flat areas are white.
With the use of the above-mentioned models, we generated contour lines. Their vertical accuracy is the same as the sources, so we were unable to describe the values, but the contour lines show the terrain perfectly.
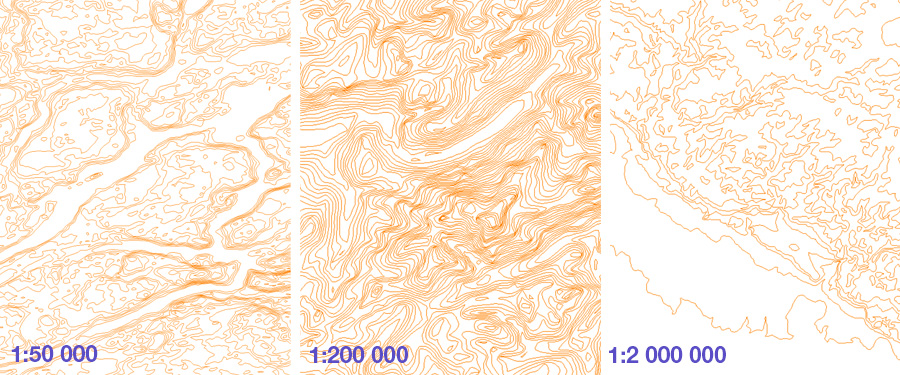
They will certainly come in handy in terms of tourist maps with large scales whereas medium and small scales, e.g. school physical maps, include colour hypsometry/ layer tints.
For oceans on small scales, we used the GEBCO model.
There was a certain problem with contour lines; whether to provide those every 20 m only, or whether auxiliary contour lines every 10 m would also be useful. In many lowland areas, they diversify the terrain, but where the coasts are steep, their density becomes too high.
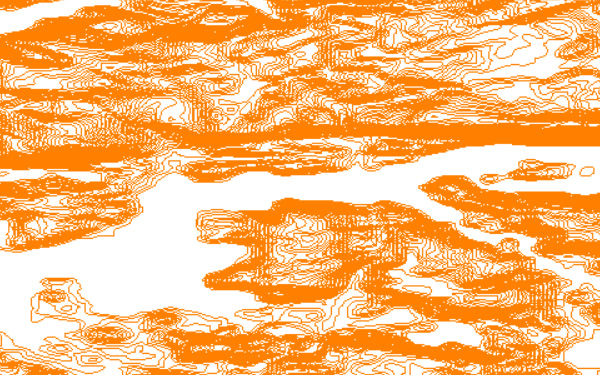
Ultimately, contour lines are every 10 m up to 300 m above sea level.
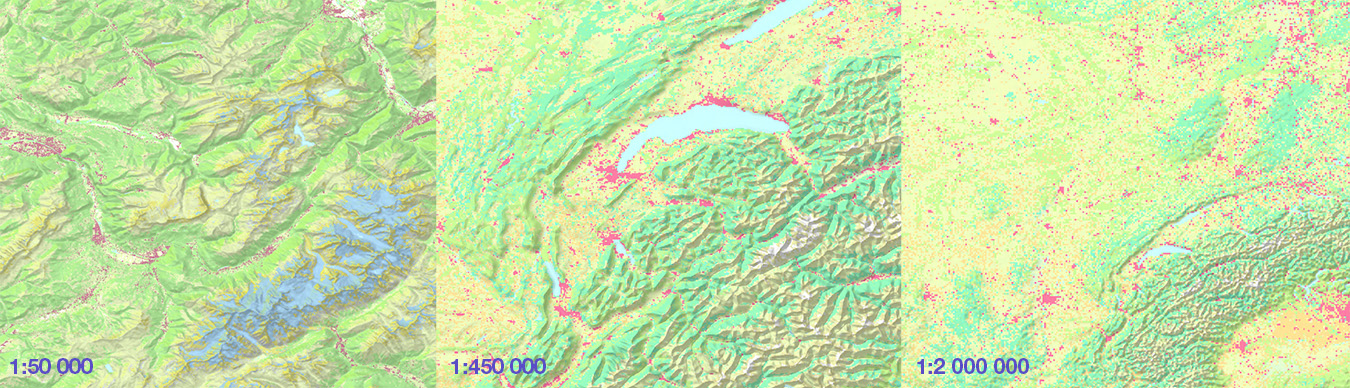
Mosaics with land use are a very valuable complement. We used ESA Global Land Cover data, presented in several resolutions. We also took into account the latest data concerning land coverage, made on the basis of Sentinel mosaics, at a resolution of 10 m, which is good for a scale of 1:50,000.
OSM, while a great base, requires additions or changes. For political reasons, the course of disputed borders, with an undetermined course, and the status of territories, have been adapted to the guidelines of the Polish Ministry of Foreign Affairs and the Commission for the Standardisation of Geographical Names Outside the Borders of the Republic of Poland at GUGiK – the borders are consistent with the official position of Poland, and can also be verified on a special map (see at the bottom of the aforementioned page).
Street names are written in OSM in full form. This is understandable, but they take up too much space on the maps.
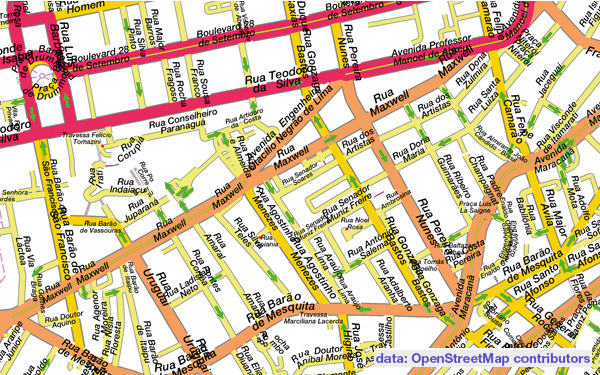
We have created a dictionary based on the OSM list, providing the possibility of shortening them as much as possible.
Proper names often contain the names of categories of objects; their distinction gives the opportunity to diversify the classification of, for example, tourist objects. We have created a dictionary for the leading Latin languages of the world, providing the possibility of such conversion.
The original names appear in OSM in all world alphabets, making them impossible to read by the average user. OSM editors do add variant names, but not always. Therefore, we have implemented a romanisation process for all names that may appear on the map; there will be also a Cyrillic version available.
A great advantage of OSM is that it is the most current database in the world. Just as in navigation, we can be sure that the roads are remarkably up-to-date, so in OSM, this also applies to many other categories. Since the world is not evenly mapped, refreshing the database not only verifies what already existed but also provides content for subsequent areas. We download the OSM database from the source once a month.
We intend to update satellite images rarely because the most important thing for us is small cloud coverage. It is also a fact that at a resolution of 10 m, changes are visible much less often than in the case of, for example, 30-centimeter images.
Maps on small scales are updated on a regular basis, but this does not apply to the population for localities, which are verified every five years.
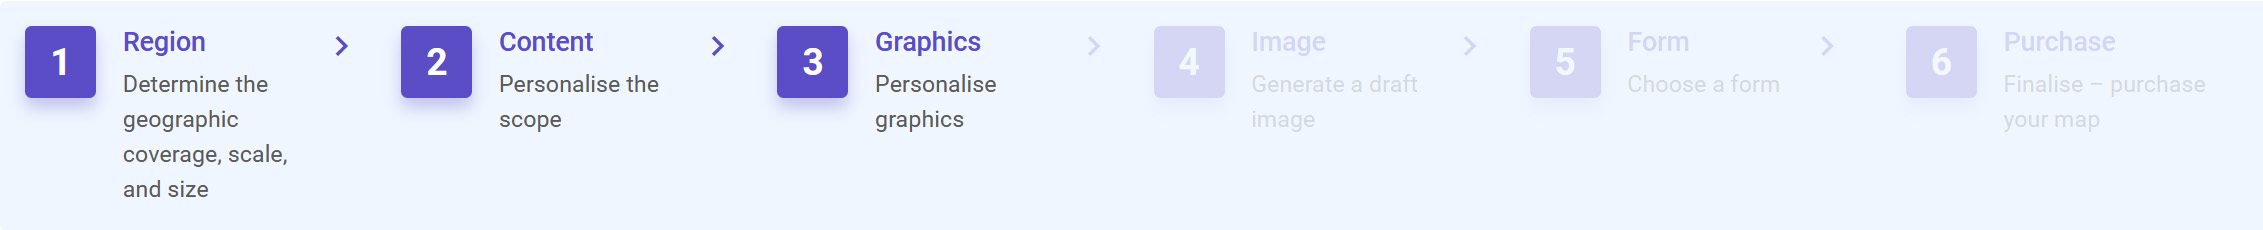
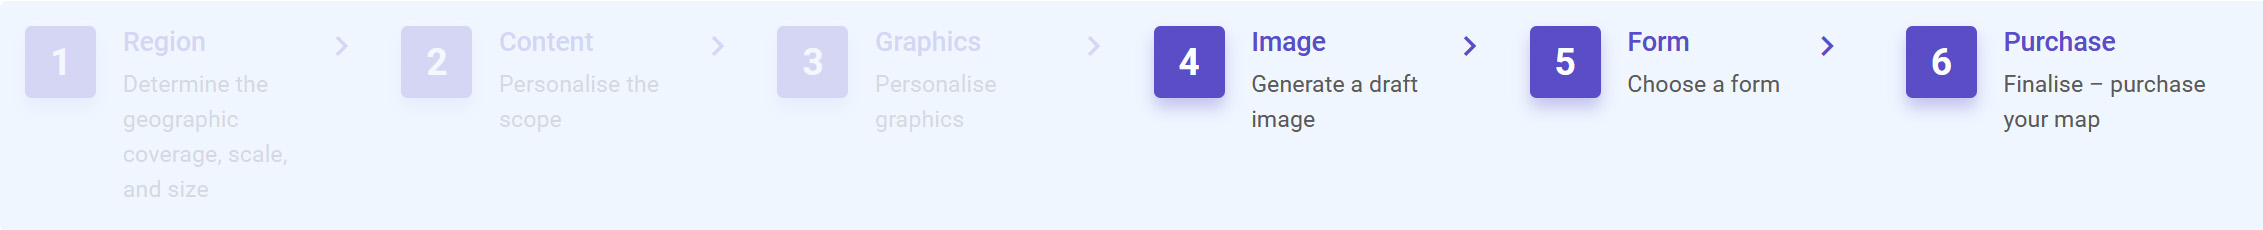
The procedure for creating maps can be conventionally divided into three parts:
– personalisation in three steps, i.e. Region, Theme, and Graphics – visible to you in the browser;
– generating a draft image – happening in the background, invisible to you. Proper maps creator;
– personalisation with a purchase in the following three steps, i.e. Image, Form, and Purchase – visible to you in your browser.
Let us now focus on the heart of the process, which is generating maps in the background. The decisions you make during the first three steps of personalisation are converted into parameters controlling the process. Data from OSM and other sources are retrieved from the server for your geographical area. The cartographic software transfers objects, arranging them on the appropriate layers and giving a graphic form to symbols.
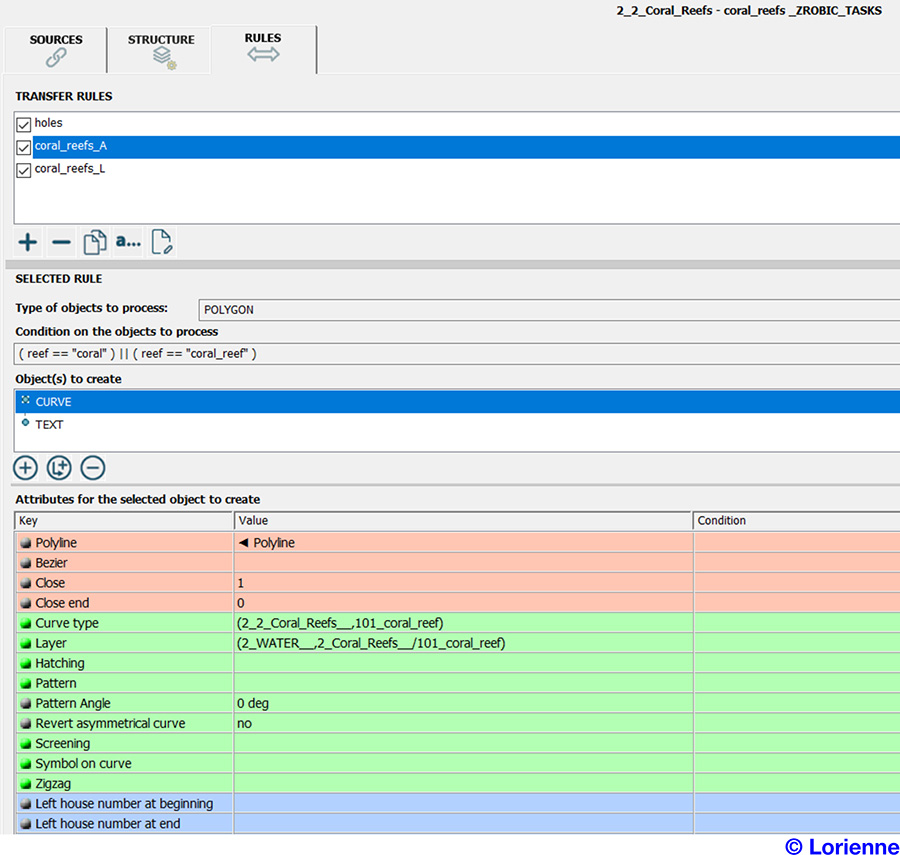
In the following step, the cartographic software carries out a qualitative and quantitative generalisation of data so that it is simplified adequately to the scale. Unnecessary layers are disabled; the graphics is changed several times to match the map to your requirements.
The ready map data is embedded in a frame with geographical coordinates, located on a conventional sheet of paper with the size you specified in step 1 of the personalisation. Next to the map, there is a legend, a publishing imprint with the licence number, and the title is at the top. There are always scales, sometimes the customer’s logo and the information entered by you.
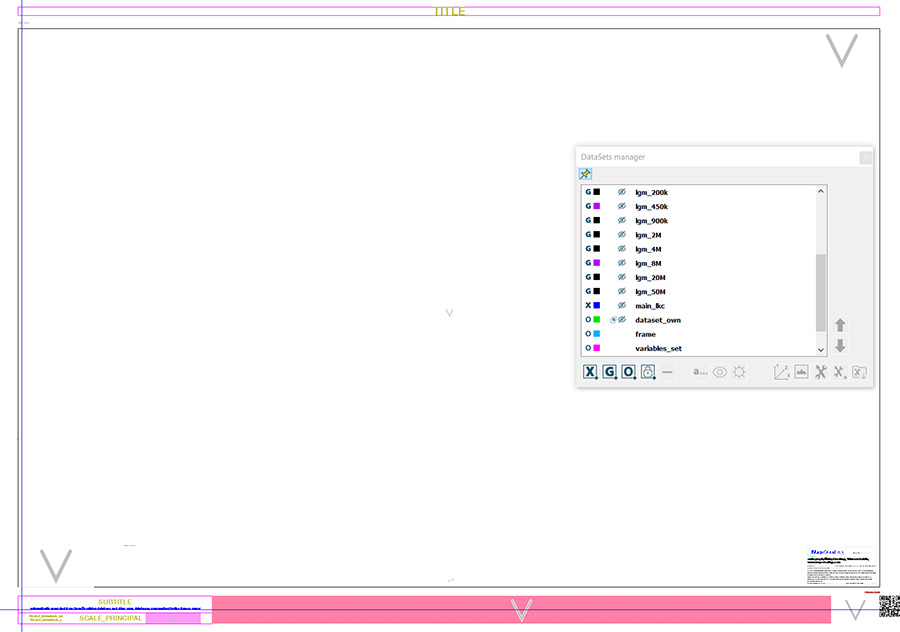
At this point, there is a need for an important note: Your work often takes place in a loop, i.e. after each of your changes in steps 1–3 and 4, the draft image of the map is generated again. It always has a resolution of 120 dpi, an RGB colour model, and a watermark.
The process ends with generating a map with the final parameters, determined by you in step 5. Exporting an image can take a long time because it is necessary to rasterize a very graphically complex image, sometimes containing tens of thousands of elements. The special quality mode slows down the speed of generating the image by ten times, but the results are exceptional, even though they are not visible at first glance. A vector image is created faster, but it is recommended for simple maps only.

You will find much more informations about how to exploit the maps here.

